Tutorial 1 : Getting started - Welcome to ASAP!
Introduction
This platform was developed initially to be able to analyze bulk or single-cell transcriptomics data. It actually integrates among the most recent and popular tools to analysis big scRNA-seq datasets. However, in principle you can play here with a matrix of numbers that has been used with other techniques as well. There are no limitation here except the relevance of applying specific analysis methods on your dataset.
The two main features of this new edition of ASAP are the following:
- Scalability. ASAP's interface and analysis tools running behind scale with big datasets, the biggest tested dataset so far was counting 1.4 millions cells.
- Reproducibility. ASAP runs analysis in a stable environment and all code and commands run on the server can be reproduced (and modified) locally on your own server / computer.
Without having a login, you can already try ASAP with any dataset, to check if it suits your needs, but the results, stored in a sandbox will by lost after your session expires. Data that are not associated anymore with a session are not accessible anymore and therefore deleted on the server. That's why we recommend you to create an account in order to have a personal space where you can keep track of your past analyses.
Pre-requisites
In order to run an ASAP analysis you only need to have a file containing a numerical matrix dataset in one of these formats:
- Plain text files (compressed or not)
- Archive containing plain text files (compressed or not)
- LOOM files (.loom)
- 10x Genomics hdf5 files (.h5)
In the case of single-cell transcriptomics, the numerical matrix contains the expression of genes in the different cells.
For more details about formats, please have a look at this page.
What can I do with ASAP?
List of analysis steps
ASAP (v5 at the time of writing this tutorial) provides a wide range of data treatment and analyses.
- Cell filtering
- Gene filtering
- Normalization
- Scaling
- Dimension reduction
- Clustering
- Differential expression
- Gene enrichment
For each step, several methods are available.
Results
What you basically get from ASAP is:
- a list of LOOM files that contain all the results of the analysis as expression matrices and metadata;
- dynamic plots for dimension reduction that you can export;
- marker genes for cell clusters after running corresponding differential expression analyses;
- a reproduction analysis script to let you run the analysis again locally on your computer/server.
First steps
Starting a new project
You start a project by hitting the "Try now!" button or after creating an account, the "New project" button. As said previously, after creating an account you will be able to save projects on the long term. If you are not loggued in, the trial project will live only the time of the browser session and be deleted. The initial form only requires you to enter a project name, the version of ASAP you want to use, the species on which you want ASAP to map gene names, and the actual file to upload. Note that the file upload scales virtually to any size of dataset.
Rather than uploading a file there are alternative ways to send the data file:
- by submitting an accessible URL where to download the file;
- by browsing the Human Cell Atlas (HCA) projects and selecting one of them
Exploring metadata stored in LOOM files
At any time analyzing your dataset, you can browse the list of metadata that have been generated by the different methods that were launched. In the left panel you will find a "Metadata and Expression Matrices" section that contain this information.
Visualizing pipelines in the report page
ASAP allows users to run in a flexible manner analyses from one step to another, so that customized pipelines can be produced directly by users. Then pipeline can get complexe and one needs to have an assistance to visualize the current structure of pipelines. In the Report section of a project, you can get a graphical representation of the current pipeline (Fig. 1) as well as the status of each analysis step (Fig. 2). Each node in the graphical view represents an analysis, and edges output-input relationships between analyses. Each node is clickable an provides the full lineage of analyses that resulted in the execution of this analysis (Fig 3).
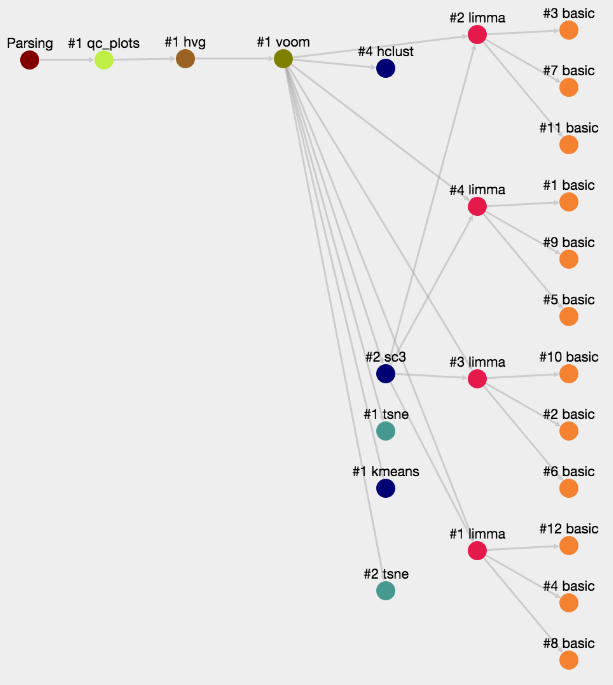 Figure 1- Graphical representation of an ASAP analysis pipeline
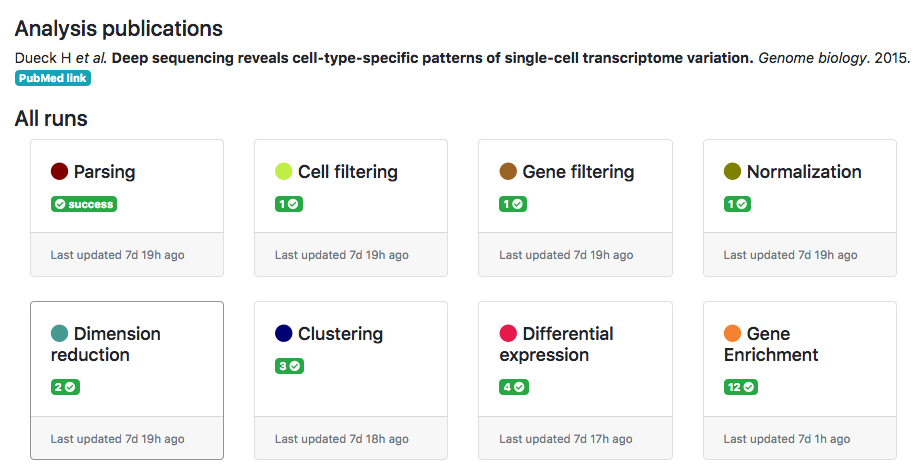 Figure 2- Status of analysis steps
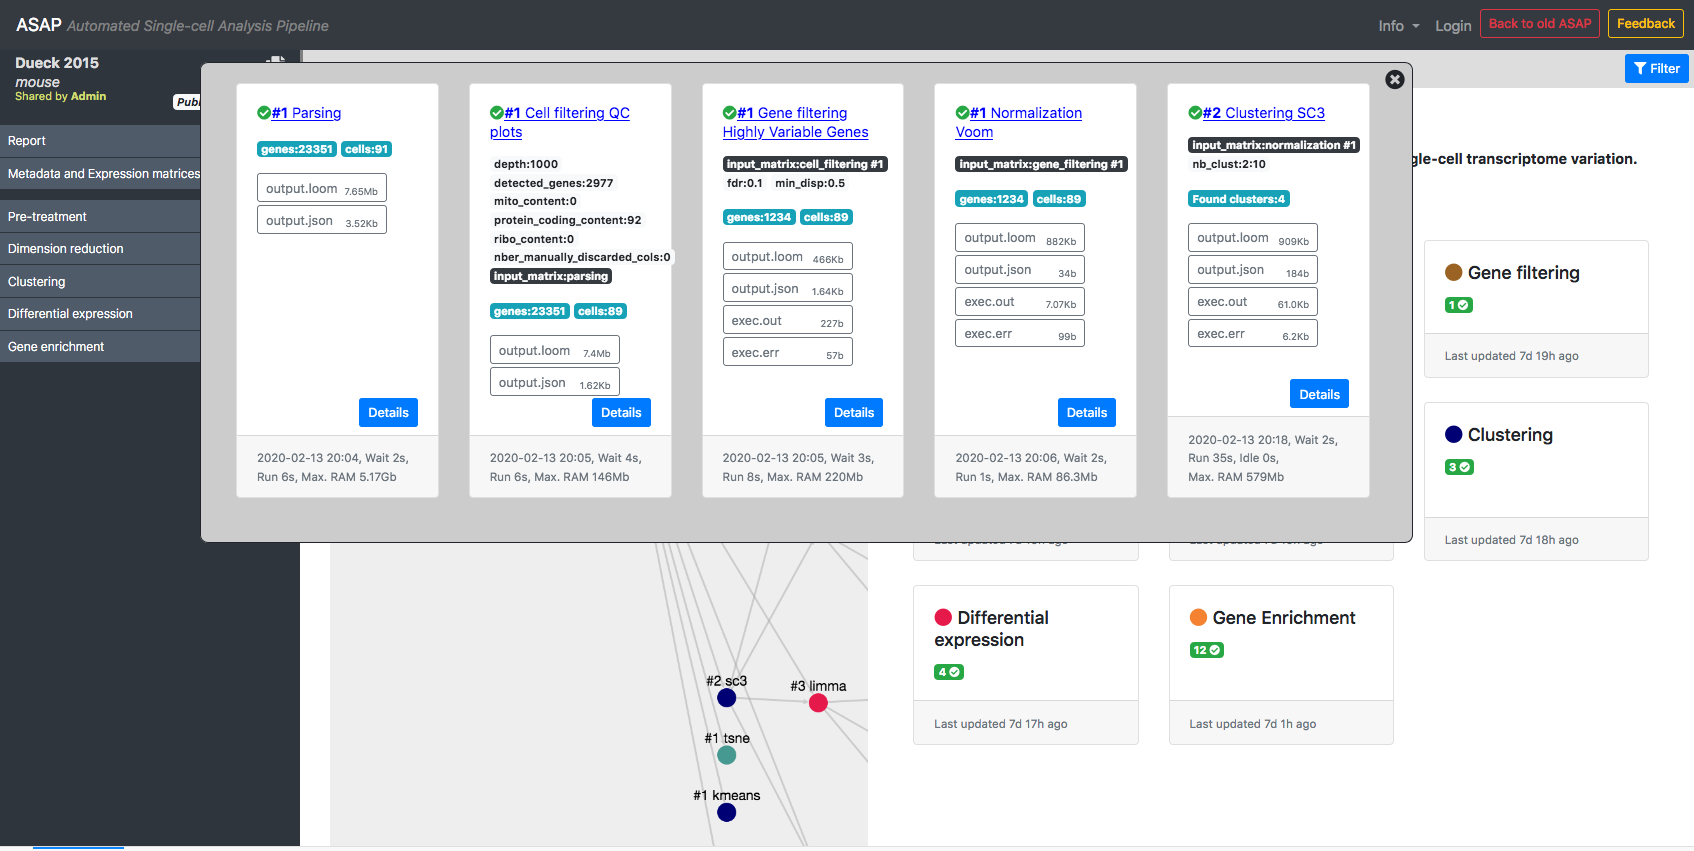 Figure 3- Lineage of analyses producing the output used by a given analysis as input.